
Too many homeowners doom their real estate investment by looking at the wrong ROI metrics...
A clear list of ROI metrics to consider in real estate investing, and how to calculate them... in normal-people speak.

- A pure, basic boring ROI
- CAGR
- IRR
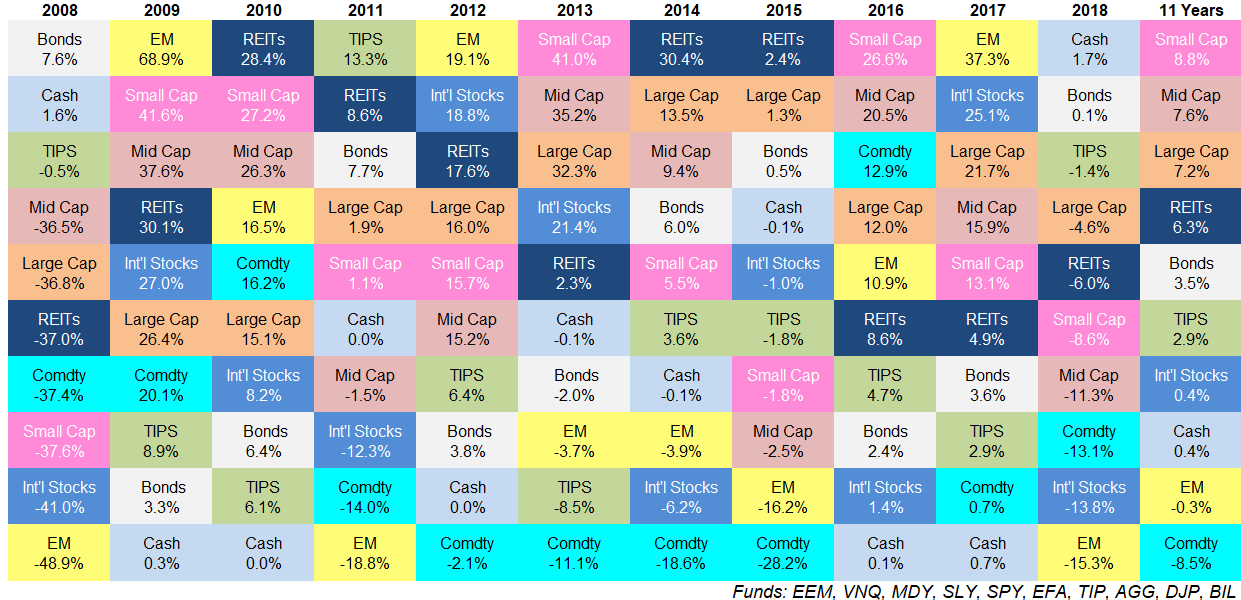
- Savings Account: National Average is .06%, but Citi has one up to 1%
- Mutual Funds: Vanguard’s 500 Index Fund averaged 13.8% annually the last 10 years
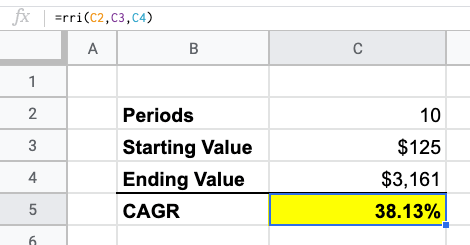
- Single Stock: Amazon’s stock averaged 38% annually the last 10 years, while GoPro’s stock has averaged -28% since it became available to the public
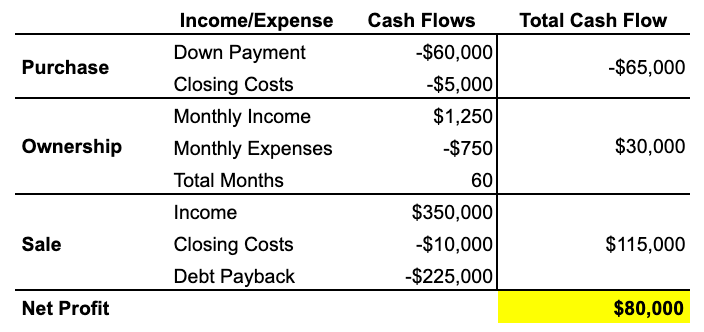
ROI = Net Profit / Cost of Investment * 100
Annualized ROI = ((1 + Overall ROI)^(1 / Years)) - 1
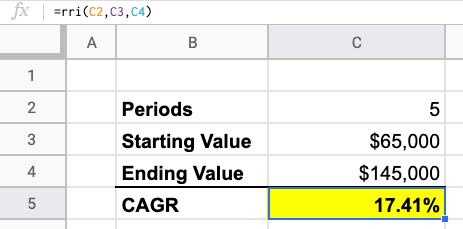
CAGR = ((Ending Value / Beginning Value)^(1 / Time Period )) -1
However, CAGR (and the annualized ROI) has two slight pitfalls. First, it assumes that all the cash earnings - your cash flow - are reinvested into the investment. Because of this, it has its second pitfall - it doesn’t account for the different periods that cash flows occur and something called the “time value of money.”
Enter IRR - an advanced ROI metric that solves all of the above issues.
Metric 3 - IRR
IRR stands for Internal Rate of Return. However, to begin, we need to talk about the "time value of money."
The general principle is that money today is worth MORE than money tomorrow.
Why?
Because money that you have today can be invested to become worth more tomorrow. Even if you didn’t invest it, inflation is going to devalue your money over time. That’s why it now costs more money to buy a burger than it did 10 years ago.
This goes back to the beginning when we talked about not putting your money under your mattress. If you do that, then that same $10,000 you have under your mattress today will still exist in 50 years, but due to inflation and everyone else investing their money, $10,000 won't be worth as much in 50 years. This is the time value of money.
So, money today is worth more than money tomorrow.
Now, in our previous ROI metrics above, a lot of money was exchanging hands at different moments in time. We did a big investment up front of $65,000 when the money was "worth the most." Then we gained $500 month after month, where each month that $500 is worth less and less. Finally, at the end, we got a big payout. However, at the end, money is worth the least because we’re at present day and our investment period (for this investment) is over.
The magic of IRR is it takes all these things - money exchanging hands at different periods of time - into consideration and finds your truest annual return.
This might sound complicated, but, again, with excel it is VERY easy to calculate (by hand it is a nightmare, so we’re not even going to explain that).
With excel, you’re going to use the same data from metric one: all your cash flows. Lay them out in a sequential manner, starting with your large initial negative cash flow from your down payment. Then you’ll have in a regular pattern all your $500 monthly cash flows. Finally, we’ll end with the cash gained from the sale.
From there, you just use excel. Enter =IRR and highlight the range and BAM, it spits out your PERIOD IRR of 1.53%. Our period is monthly because our cash flows were monthly, but we can annualize this by multiplying our results by 12 to get 18.39%.
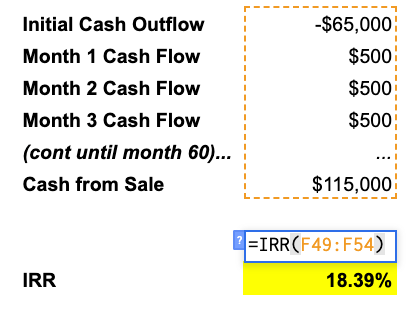
This metric is higher than CAGR and the Annualized ROI because it accounts for the time value of money being earned early on.
One quick note - if your cash flow activities are irregular, you can actually use the XIRR function in excel instead, and include the dates of each cash flow activity.
There you have it, three ROI metrics.
So which one do I use?
If you are just interested in the
overall
return of an investment, use Metric 1 - ROI.
If you want to know the
annual
ROI and but don’t have excel handy or don’t want to get into exact monthly cash flows, use CAGR.
If you want to be more exact on your annual returns, and have excel, use IRR.
Another benefit of IRR is it can help you decide between two different investments with different scenarios and different estimated payoff periods because of this accounting for the time value of money. In the below example, even though the profit is the same for each scenario, Scenario 2 has a higher IRR because it collects that profit faster, allowing it to theoretically be reinvested elsewhere.
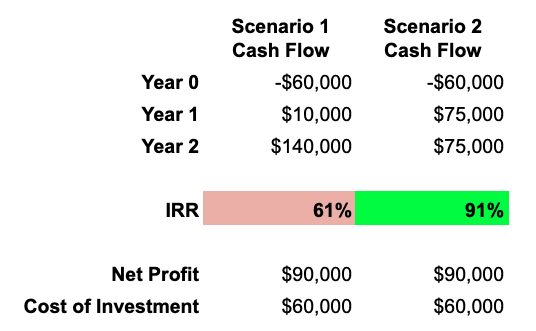
In the above example, we used the same time period for the two scenarios. However, another good reason to use IRR is if you happen to have two scenarios with radically different investment periods it standardizes the output to a comparable yearly return for each investment.
Final Thought.
As always, if you don't want to have to track all this yourself and then on top of that, have to know when to use what, just use the
WayBoz app. It truly is the easiest way to manage how well all your properties are doing, it guides you to know what metrics to look at when, and informs you when it's time for a change to ensure you are maximizing your profits.
Sign up today to lock in some amazing early-access rates.
Our next article will be closing the loop on all these metrics we’ve been discussing the last few weeks. We’ll be sharing our secrets on when to use Return on Equity, Cash on Cash, IRR, and other metrics to make sure that retirement account of yours is regularly growing.
Follow us on social media to stay up to speed on all we're doing. Two quick places where you should follow us are:
LinkedIn: https://www.linkedin.com/company/wayboz/
Our Blog: https://medium.com/@wayboz